Introduction

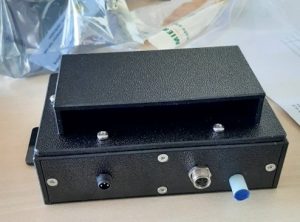
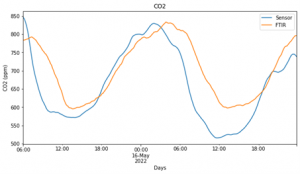
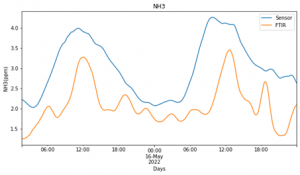
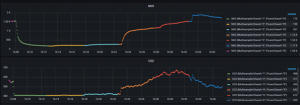
OTICE, short for Online Tool for monitoring Indoor barn Climate and Emissions. Is a prototype low-cost system to work towards a low-cost emission monitoring in dairy farms. Up to this day, measuring emissions in dairy barns, especially naturally ventilated barns, is a challenging and expensive task, which requires expert knowledge and advanced, fragile, difficult to operate equipment. This approach is suitable for determining emission factors for legislation, but it is well known that this does not capture the inherent inter-barn variability. Therefore individual monitoring is necessary. The OTICE system consists of two parts: A modular sensor network and an online dashboarding tool to visualize the data.

Sensor network

The modular sensor network, consists of multiple sensorboxes, of which an example is displayed in Figure 1, which communicate wirelessly with each other. Each sensorbox contains multiple low-cost sensing components: Gas sensors that can detect NH3, CO2 and sensors that measure the barn climate, such as Temperature, Relative humidity and barometric pressure. The data can either be logged remotely in a cloud database owned by the manufacturing company, or it can be logged on a local computer.

Figure 1: Picture of a sensorbox

The readings of the low-cost sensors were compared to high-end analyzers, to assess the measurement quality. An example of a comparison between the CO2 values of a sensorbox and an FTIR device are displayed in Figure 2 and a comparison between their respective NH3 values in Figure 3. It is clear that the low-cost sensor is able to follow the concentration trends of the high-end FTIR analyzer. However, certainly for NH3, the deviation of the sensorbox is still too large to trust the absolute values of the sensorbox readings.

Figure 2: Comparison of CO2 measurements between FTIR and OTICE

Figure 3: Comparison of NH3 measurements between FTIR and OTICE

Dashboarding tool

The online dashboard consists of a set of open-source software tools widely available and documented. The graphical interface, on which the data can be visualized, is Grafana, a widely used dashboarding tool that offers a variety of options when it comes to display the data in a concise and clear manner. The data itself is stored in an open-source database InfluxDB. It is important to note that this sensor network needs to be calibrated, as the barn climate will influence the readings of the sensor components, which needs to be corrected. To incorporate the information of calibration as well as perform some cleaning before the data is stored in the database, a third software tool is used, called NodeRed, which is a graphical programming tool that makes programming more intuitive with graphical tools. NodeRed is also able to communicate with other sensor systems. This means that other sensor systems can be combined into OTICE, which makes it a flexible system for future developments. An example of a dashboard visualization in Grafana, which displays concentrations measured with a high-end picarro gas analyzer is shown in Figure 4. Each color denotes measurements in a different location in the barn, which is encoded in metadata when the measurements are collected.

Figure 4: Example dashboard of gas concentration measurements

An example dashboard of OTICE measurements is shown below. These sensors were installed as a plug-and-play system and collected data during the month of august 2024. Although the trends of the sensors reliably show trends in the barn air concentrations, a calibration will be necessary to improve the accuracy of these measurements in the future.

Barn Sensors Overview:

Barn ground plan

Try clicking the clusters

  • {1, 2},
  • {3, 4} or
  • {5, 6, 7, 8, 9, 10}

... on the image below:

NE cluster SW cluster Barn cluster

North-East sensor cluster dashboard {3, 4}

South-West sensor cluster dashboard {1, 2}

Barn sensor cluster dashboard {5, 6, 7, 8, 9, 10}

References

Zhuang, S.; Brusselman, E.; Sonck, B.; Demeyer, P. Validation of five gas analysers for application in ammonia emission measurements at livestock houses according to the VERA test protocol. Applied Sciences 2020, 10, 5034.

Wang, C.; Yin, L.; Zhang, L.; Xiang, D.; Gao, R. Metal oxide gas sensors: sensitivity and influencing factors. sensors 2010,10, 2088–2106.

Zhuang, S.; Van Overbeke, P.; Vangeyte, J.; Sonck, B.; Demeyer, P. Evaluation of a Cost-Effective Ammonia Monitoring System for Continuous Real-Time Concentration Measurements in a Fattening Pig Barn. Sensors 2019, 19, 3669.

Janke, D.; Willink, D.; Ammon, C.; Hempel, S.; Schrade, S.; Demeyer, P.; Hartung, E.; Amon, B.; Ogink, N.; Amon, T. Calculation of ventilation rates and ammonia emissions: Comparison of sampling strategies for a naturally ventilated dairy barn. Biosystems Engineering 2020, 198, 15–30.

Coorevits, K.; Janke, D.; Laanen, L.; Amon, B.; Brusselman, E. Ammonia measurements in a naturally ventilated dairy barn with a low-cost sensor system. EAAP 76th annual meeting 2025, Innsbruck, Austria.